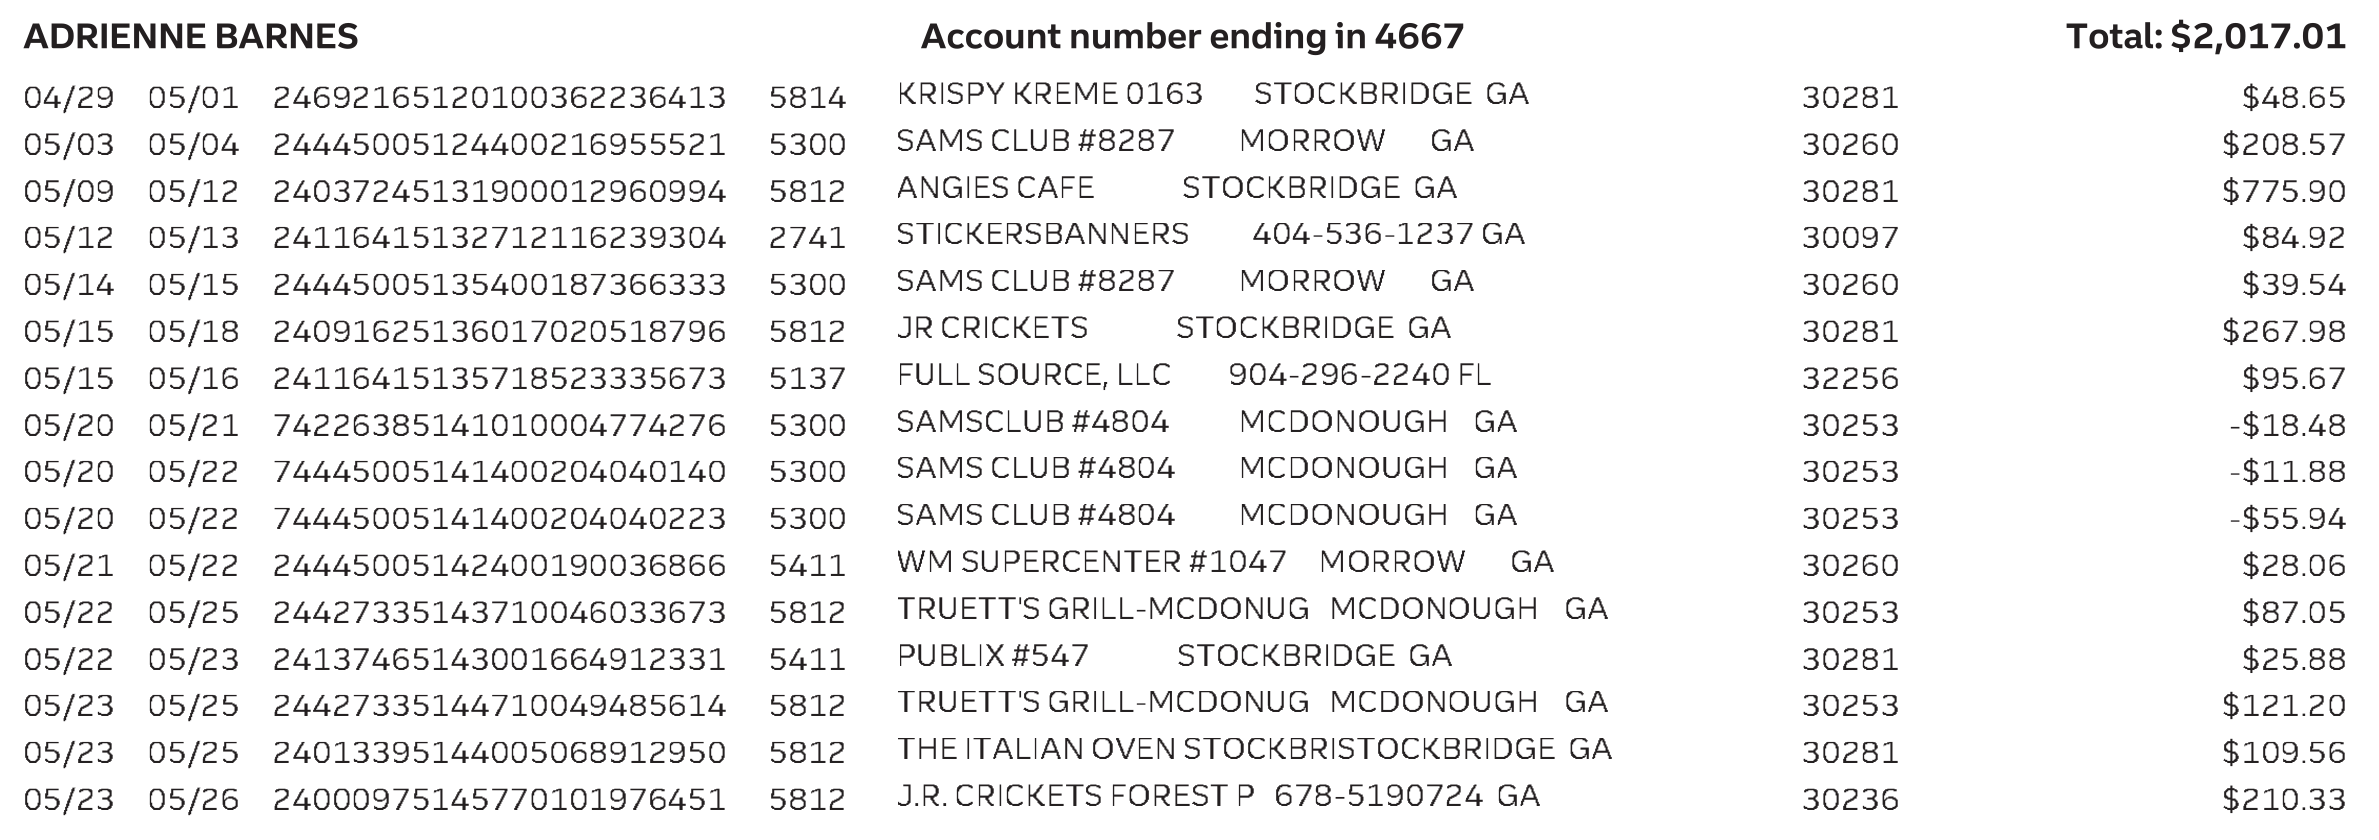
All figures verified against the raw bank statements (17 Truist One Card billing cycles, Feb 2025 – Jun 2026; 2,793 transactions, $744,442.38) and the WEX fuel export (July 2024 – July 2026; 18,402 fills, $822,321.13). Department assignments come from the City’s own published staff directories, the fuel export’s department field, and public employment records.
The card program
Forty-one city purchasing cards are in circulation. Sorted by department, the spending looks like this:
| Department | Cards | Txns | Total | Share |
|---|---|---|---|---|
| Events & Conference Center | 4 | 603 | $177,261.78 | 23.8% |
| Administration & Finance (incl. Procurement/Purchasing) | 8 | 476 | $149,569.26 | 20.1% |
| Police | 3 | 576 | $139,172.56 | 18.7% |
| City Manager’s Office | 3 | 297 | $67,830.33 | 9.1% |
| City Council (6 seats) | 6 | 131 | $44,397.59 | 6.0% |
| Public Works (incl. water/sewer/sanitation admin) | 4 | 140 | $37,549.01 | 5.0% |
| Community Development | 1 | 148 | $31,538.45 | 4.2% |
| Human Resources | 4 | 104 | $27,629.68 | 3.7% |
| Economic Development / DDA | 2 | 71 | $20,399.32 | 2.7% |
| Mayor’s Office | 1 | 56 | $13,041.01 | 1.8% |
| City Clerk’s Office | 1 | 80 | $13,017.66 | 1.7% |
| Municipal Court | 1 | 33 | $5,125.79 | 0.7% |
| Business Services | 1 | 18 | $4,443.10 | 0.6% |
| Not attributable to a department | 2 | 60 | $13,466.84 | 1.8% |
| Total | 41 | 2,793 | $744,442.38 |
Three departments — Events, Administration & Finance, and Police — account for 62.6% of everything charged to a city card in this period. One card in the Events department alone carries $114,211.02 (15.3%).
The one card that is its own department
The Events & Conference Center’s largest card deserves separate treatment because its volume reshapes the whole program. In 15 billing cycles: 386 transactions, $114,211.02, average charge $315.64, single largest $5,015.35 (a peer-to-peer payment). August–September 2025 alone is $33,020.85 — 29% of the card’s two-year total in two months, consistent with fall festival season but meaning the city’s entire event spend for that season ran through one card with no visible purchase-order structure.
Where that money went (verified rollup, reconciles to the penny):
| Use | Amount |
|---|---|
| Printing / signage / marketing | $16,853.27 (66 txns) |
| Grocery / warehouse club cash-and-carry | $13,605.02 (61 txns) |
| Peer-to-peer payments to individuals (PayPal) | $10,440.35 (10 txns) |
| Hotel — inside the city limits | $9,101.28 (19 txns) |
| Hotel — elsewhere (airport, Nashville, other) | $8,790.11 (18 txns) |
| Talent booking & music licensing | $7,669.16 (11 txns) |
| Amazon marketplace (unitemized) | $7,150.19 (55 txns) |
| Event services (flowers/balloons) | $6,847.03 (12 txns) |
| Square-network payments to local vendors | $5,006.51 (18 txns) |
| Self-storage | $3,033.20 (6 txns) |
| Dining | $2,388.34 (21 txns) |
| Airfare | $1,767.90 (4 txns, all booked the same day) |
| Office supplies | $1,491.99 (9 txns) |
| Other (software, apparel, hardware, transport) | $20,066.67 (76 txns) |
The hotel spend splits into two problems. $9,101.28 was charged at one hotel inside the city the cardholder works for — including a single $4,298.96 charge and a three-day burst of fifteen charges totaling $6,420.92, eight of them $131–$154 each (one room-night apiece). Another $8,790.11 went to hotels nowhere near a Stockbridge event: an airport Westin ($4,618.24, including the same $1,559.30 charge twice) and a Grand Hyatt in Nashville ($1,294.87).
The peer-to-peer money is the structural problem. Ten PayPal payments to six recipients — $5,015.35 to one of them in a single charge — plus $3,969.70 across nine Square charges to one vendor. These are vendor-sized payments made without vendor infrastructure.
What each department charged that taxpayers shouldn’t fund
Sorting all 2,793 transactions through one classifier (each transaction counted once, in its best-fit category), the categories a taxpayer would reasonably expect NOT to fund on a city card total $132,328.68 across 519 transactions — 17.8% of all card spend:
| Category | Amount | Txns |
|---|---|---|
| Dining, fast food & catering | $67,318.51 | 315 |
| Payment apps to named individuals (PayPal / Cash App / Venmo / Zelle) | $25,034.05 | 34 |
| Clothing & personal retail | $16,184.88 | 74 |
| Hotel rooms in our own city | $11,383.23 | 21 |
| Entertainment & amusements | $7,926.77 | 26 |
| Florists, gifts & balloons | $4,279.13 | 25 |
| Personal grooming | $277.11 | 4 |
| Sports betting (net of reversals) | −$75.00 | 20 |
| Total | $132,328.68 | 519 |
A further $18,609.24 (49 txns) ran through Square, reported separately because most of it is small local vendors.
Now the same improper-spend lens, by department:
| Department | Improper-category $ | Txns | Share of that dept’s spend |
|---|---|---|---|
| Events & Conference Center | $51,730.16 | 138 | 29.2% |
| Administration & Finance | $24,300.32 | 82 | 16.2% |
| City Manager’s Office | $16,275.47 | 89 | 24.0% |
| Police | $14,581.97 | 80 | 10.5% |
| Public Works | $7,375.86 | 17 | 19.6% |
| Unattributed | $5,988.78 | 22 | 44.5% |
| Human Resources | $4,379.52 | 23 | 15.9% |
| Mayor’s Office | $2,076.64 | 27 | 15.9% |
| Clerk’s Office | $1,535.44 | 10 | 11.8% |
| Community Development | $1,472.71 | 7 | 4.7% |
| Economic Development | $1,120.48 | 10 | 5.5% |
| Municipal Court | $733.73 | 5 | 14.3% |
| Business Services | $547.07 | 4 | 12.3% |
| City Council | $210.53 | 5 | 0.5% |
The Events department carries almost 40% of the program’s improper-category dollars — but nearly half its own spend falls in those categories, driven by person-to-person payments, in-city hotel rooms, and the festival-season dining that a public-events operation inevitably generates. The City Manager’s Office and Public Works run improper-category rates above 19%; the Council, by contrast, is effectively clean at 0.5%. That is “clean” if you don’t count this money as buying their next election.
Dining alone — $67,318.51 across 315 charges — is spread through almost every department: 35 of 41 cards bought food. The largest single catering charges run from $3,150.00 (one caterer, two charges) down through $2,515.21 (a Birmingham, AL caterer), $1,780.00, $1,517.50, $1,200.00, $1,024.05, and $1,000.00. Two Stockbridge Chick-fil-A locations absorbed $1,560.22 and $1,387.60; one local restaurant took $1,773.86 across eight visits; another $1,336.65 across four.
Grocery and warehouse-club buying — Publix, Walmart, Sam’s Club, Costco — adds a further $68,945.03 across 525 transactions of cash-and-carry purchasing done on cards instead of through vendor accounts.
Reversals: the quiet remedy — and the one exception
The statements contain 176 reversal transactions totaling $43,634.50, spread across 30 of the 41 cardholders. Three-quarters of everyone who held a card got at least one charge quietly credited back. The reversals include:
- Online gambling, reversed to near-zero. Sports-betting app charges appear on three management cards (HR, IT, Events): $505.00 charged, $580.00 credited, net −$75.00. The city’s entire response to gambling on public cards was an accounting adjustment. No discipline appears in the record.
- Luxury and personal charges, reversed. One HR card carries a $2,543.70 demolition charge, a $1,349.38 luxury-apartment charge, a $1,000 custom-jewelry charge, and a $945.57 leasing charge — every one credited back, along with home cable/internet bills. The cardholder separated in September 2025; the reversals ran through November.
- The same quiet fix across the program. The Clerk’s Office received $4,643.15 in reversals (legitimate convention-registration refunds, for the record), Public Works $4,159.59, the City Manager’s Office $2,824.00, and two dozen more cardholders all received credits without consequence.
Set against that backdrop: the removed mayor. His personal-use charges — restaurants, clothing, a haircut, a movie — totaled roughly $4,000, and he repaid them. His entire two-year card history shows a single reversal, $35.76. He is the only cardholder in this dataset removed from office over P-card use.
The question the city has never answered: why was the remedy for everyone else — repay and reverse, no discipline — denied to the one elected official who actually repaid? If a $1,349.38 luxury-apartment charge on an HR card is handled with a quiet credit, and a $505.00 gambling tab across three directors’ cards nets to zero without a single termination, what made repaid restaurant meals the exception that justified removal?
The fuel bill, by department
The WEX export is fuel only: $822,321.13 across 18,402 fills over 25 months — roughly $411,160/year, $32,893/month, $44.69 per fill. By the department field in the city’s own export:
| Department | Fills | Total | Share |
|---|---|---|---|
| Police | 12,513 | $501,629.25 | 61.0% |
| Public Works (roads/maintenance) | 2,356 | $136,401.54 | 16.6% |
| Water & Sewer | 1,646 | $90,496.45 | 11.0% |
| Sanitation | 471 | $29,405.04 | 3.6% |
| Unassigned | 484 | $21,750.91 | 2.6% |
| Water Reclamation | 261 | $13,692.67 | 1.7% |
| Community Development | 222 | $11,544.88 | 1.4% |
| Code Enforcement | 121 | $5,148.11 | 0.6% |
| Conference Center motor pool | 126 | $4,411.75 | 0.5% |
| Mayor’s Office | 45 | $2,595.53 | 0.3% |
| Administration | 78 | $2,558.15 | 0.3% |
| City Manager’s Office | 45 | $1,487.99 | 0.2% |
| City Council | 30 | $1,100.79 | 0.1% |
| Municipal Court | 4 | $98.07 | 0.0% |
Two-thirds of the fuel bill is police cars; that is normal for a department that runs shifts on the road. What is not normal:
- A department called “Unassigned” burned $21,750.91. 484 fills across 16 vehicle IDs with no department attached — and 401 of those 484 fills ($17,737.11) belong to a single driver, across nine different vehicle IDs, from July 2024 through March 2026. One person, no department, nine vehicles.
- The vehicle file can’t identify a third of the fleet. The export contains 198 card numbers, 190 vehicle/asset IDs — and only 127 distinct VINs. Sixty-five asset IDs share a VIN with another asset ID, meaning the city’s own fuel file cannot distinguish the vehicles a third of its fuel dollars flow to.
- Round-dollar “fills” that aren’t fills. Seventy-six fills totaling $14,800.13 are exact multiples of $100; 75 of the 76 are at Sunoco, and 54 are exactly $200.00. Round-dollar amounts at a pump are prepayments and card-loads, not measured fuel — sitting inside the fuel total unmarked.
- Elected-official fuel exists as its own line items. Ten vehicle IDs tagged COUNCIL (~$530/year combined) and four tagged MAYOR ($2,595.53 in 2026 alone — a run-rate well above the earlier estimate, because the mayor-tagged fuel all falls inside seven months). Small dollars; a documented per-seat take-home-vehicle culture in the city’s own export.
- Separated employees kept fueling. One Public Works employee retired in late 2023; the export shows his PIN buying fuel for 13 consecutive months afterward — $2,714.46 across 58 fills, almost entirely on one vehicle. A purchasing card belonging to an Economic Development director who separated in October 2025 kept charging for seven more months — roughly $5,575 net, including a $3,214.28 month in January 2026. The audit finding is the gap between separation date and card/PIN deactivation — and nobody has produced the deactivation records.
The highest-risk pattern in the file: cash to individuals
Across at least ten cards in six departments, the statements contain PayPal, Square, and Cash App payments naming private individuals rather than vendors — $25,034.05 across 34 transactions in the improper-category table, plus more inside the Square band. The single largest: a $3,965.50 Cash App payment to an individual in Oakland, California, from an Administration & Finance card, on 01/02/2026 — the same card, the same day, also sent $500.00 through Square to another person-named recipient. No city vendor by that name surfaces in public records.
Person-named P2P payments are the highest-risk pattern a purchasing card can carry: no vendor documentation, no tax reporting, no competitive procurement. One religious-radio PayPal recipient appears on cards in two different departments, suggesting coordinated routing rather than isolated lapses.
The biggest question we’re left with is who was gambling with city P-Cards, who flagged it & who was gambling with P-Cards? It could be someone was the victim of card skimming, thus, innocent. I’ll give the benefit of the doubt here. For the sake of argument, let’s say by Stockbridge & Georgia state law no rules were technically broken here. Is this spending what you would call “government spending.” I think the party, dining & grocery bill are way too high. I think, when we talk about that $32 million dollar budget amendment (among other budget fiascos), this is the spend we’re refering to.
I’d provide more open records but we’re frozen out completely. We asked for Truist Payment Card related documents back in July. The documents seen here were not sent by the clerk’s office. After receiving these from a confidential source we inquired of the clerk as to the status of same. We received a terse note that, “our request had been received.” I suppose we can close that now and move on to District 5’s $100,000+ phone bill and the other $100,000 Verizon bill.
How did you run up more than the city wide phone bill in your district, Mr. Mayor Alexander? 🙄
Methodology note: department assignments were made from the City of Stockbridge’s published staff directories, the WEX export’s own “Driver Department” field, and public employment records; two cardholders (60 transactions, $13,466.84) could not be confidently assigned and are reported as “Unattributed.” Improper-category classification uses a single canonical classifier applied identically to every transaction; program totals reconcile to the statement totals to the penny. This is informational; consult a licensed attorney in the relevant jurisdiction.